TechRadar Verdict
ClickCharts is extremely inexpensive and simple to get started with. While the outdated interface can be forgiven, the lack of advanced diagramming tools is a major drawback.
Pros
- +
Very inexpensive for a lifetime license
- +
Around 50 templates available
- +
Interface doesn't have a learning curve
Cons
- -
User interface is very outdated
- -
No object alignment or layering panels
- -
Very limited shape and object customization
Why you can trust TechRadar
ClickCharts is a simple, but effective process mapping software. The platform is very easy to get started with, in part because it limits you to just the basics of mind mapping. While the user interface makes it look like the software was made in the 1990s, it’s hard to argue with the low price.
Is ClickCharts the best process visualization software for your needs? Let’s take a look at everything this platform has to offer.
Plans and pricing
ClickCharts is extremely inexpensive. You can download the software for free to try it out, but bear in mind the free version should not be used for commercial purposes.
It’s unclear how the free download differs from the paid version of the software, which costs $50 for non-commercial use or $60 for business use. Keep an eye out for sale pricing, as the software was 50% off at the time of writing.

Features
ClickCharts focuses on the essential features of process mapping. You won’t find many frills in this software, but it does a good job of covering the basics and making them easy to access.
Templates
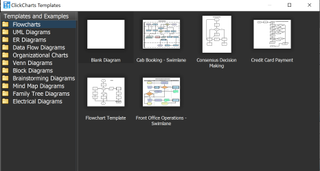
When you launch a new diagram in ClickCharts, you’re prompted to choose a template or start from scratch. There are about 50 different templates available, organized into categories such as electrical wiring diagrams, family trees, Venn diagrams, and organizational charts. The diversity of choices is nice, although it would be good to see a larger number of templates in each category.
Surprisingly, it’s not possible to save your current diagram as a new template. That’s a little annoying, although you can still load a previous diagram for use as a starting point if you save a duplicate of it.

Shapes and Connectors
There’s a reasonably wide variety of shapes and connector styles available within ClickCharts. While you can’t design a custom shape, you can import images into your diagrams. This isn’t quite so seamless, but it does work in a pinch.

You can also easily add text to your diagrams and it’s impressively customizable. You can choose from hundreds of fonts, as well as standard formatting options like italics and bolding. Unfortunately, there’s no auto-align function when combining text with shapes, so placing text requires some fine adjustments.
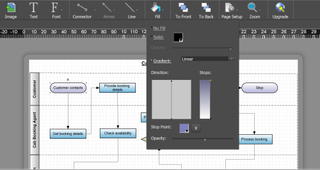
ClickCharts gives you some room to customize the look of your charts by modifying shape styles, but not a ton. The color fill function allows you to alter opacity and create color gradients, and you can layer objects by moving them forwards or backwards in space. However, there are no alignment functions or trackable layers, and you can’t actually modify the line paths of any existing shapes.

Publishing and Sharing
When it comes time to share your completed chart, ClickCharts gives you a few options. You can save the chart as a JPG, PNG, or PDF, or email it directly from the software. There’s even an option to publish your diagram to Twitter.
Interface and in use
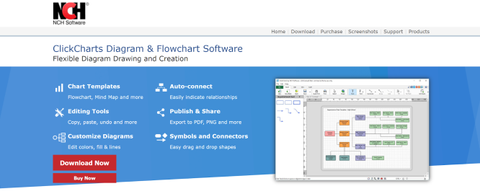
Both the ClickCharts website and software look out of date. The interface has the look and feel of Microsoft Word circa 1999 rather Adobe Illustrator today. But, the software’s menus are easy to navigate and all of the tools you need are available with just a few clicks.
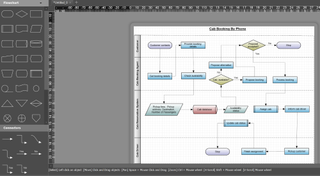
For example, the full library of shapes and connectors in ClickCharts at hand in a left-side menu at all times when you’re building a new diagram. They’re arranged into categories that correspond with the theme categories, which makes it very easy to find the shapes and arrows that you need for a given project. To place a shape, all you have to do is drag and drop. When adding connectors to your diagram, an auto-snap function makes the process go much more smoothly.
Still, a more modern interface might open up room to add useful tools like object alignment or panels for layering and design. The way the interface is set up, it’s necessary to jump back and forth between menus if you want to place an object and then change its coloration or size. It’s also not all that easy to bulk edit objects that are the same shape, which adds time to the customization process.
Support
ClickCharts provides support by email, although you may find yourself waiting more than a day to get a response from the company. There’s a small help section online, but it’s far from comprehensive. If you do run into issues with the software, your best bet may be to post on the ClickCharts online forum.
The competition
ClickCharts sticks to the basics and doesn’t charge much for its product. However, if you need more functionality, there are a few premium alternatives.
Mindomo and Xmind both have much more modern user interfaces and offer more room for customizing your mind maps and charts. Mindomo stands out for offering Gantt charts and a suite of collaboration features, which can be very helpful if you’re working in a team. Expect to pay significantly more for either of these platforms, though: Xmind costs more than double what ClickCharts charges, while Mindomo is only available as a subscription.
Final verdict
ClickCharts is a very inexpensive diagramming and mind mapping software. It’s a great option if you don’t mind the outdated user interface and only need a limited suite of customization tools for your charts. However, the fact that it’s difficult to create custom shapes and the lack of advanced controls like object alignment and designated layers can be problematic if you need more flexible diagrams.
Michael Graw is a freelance journalist and photographer based in Bellingham, Washington. His interests span a wide range from business technology to finance to creative media, with a focus on new technology and emerging trends. Michael's work has been published in TechRadar, Tom's Guide, Business Insider, Fast Company, Salon, and Harvard Business Review.


